Dashboards
The home page of the Kapa platform is a set of dashboards, one per preset in the toolbar, aggregating metrics across every project you have access to. The data is refreshed daily.
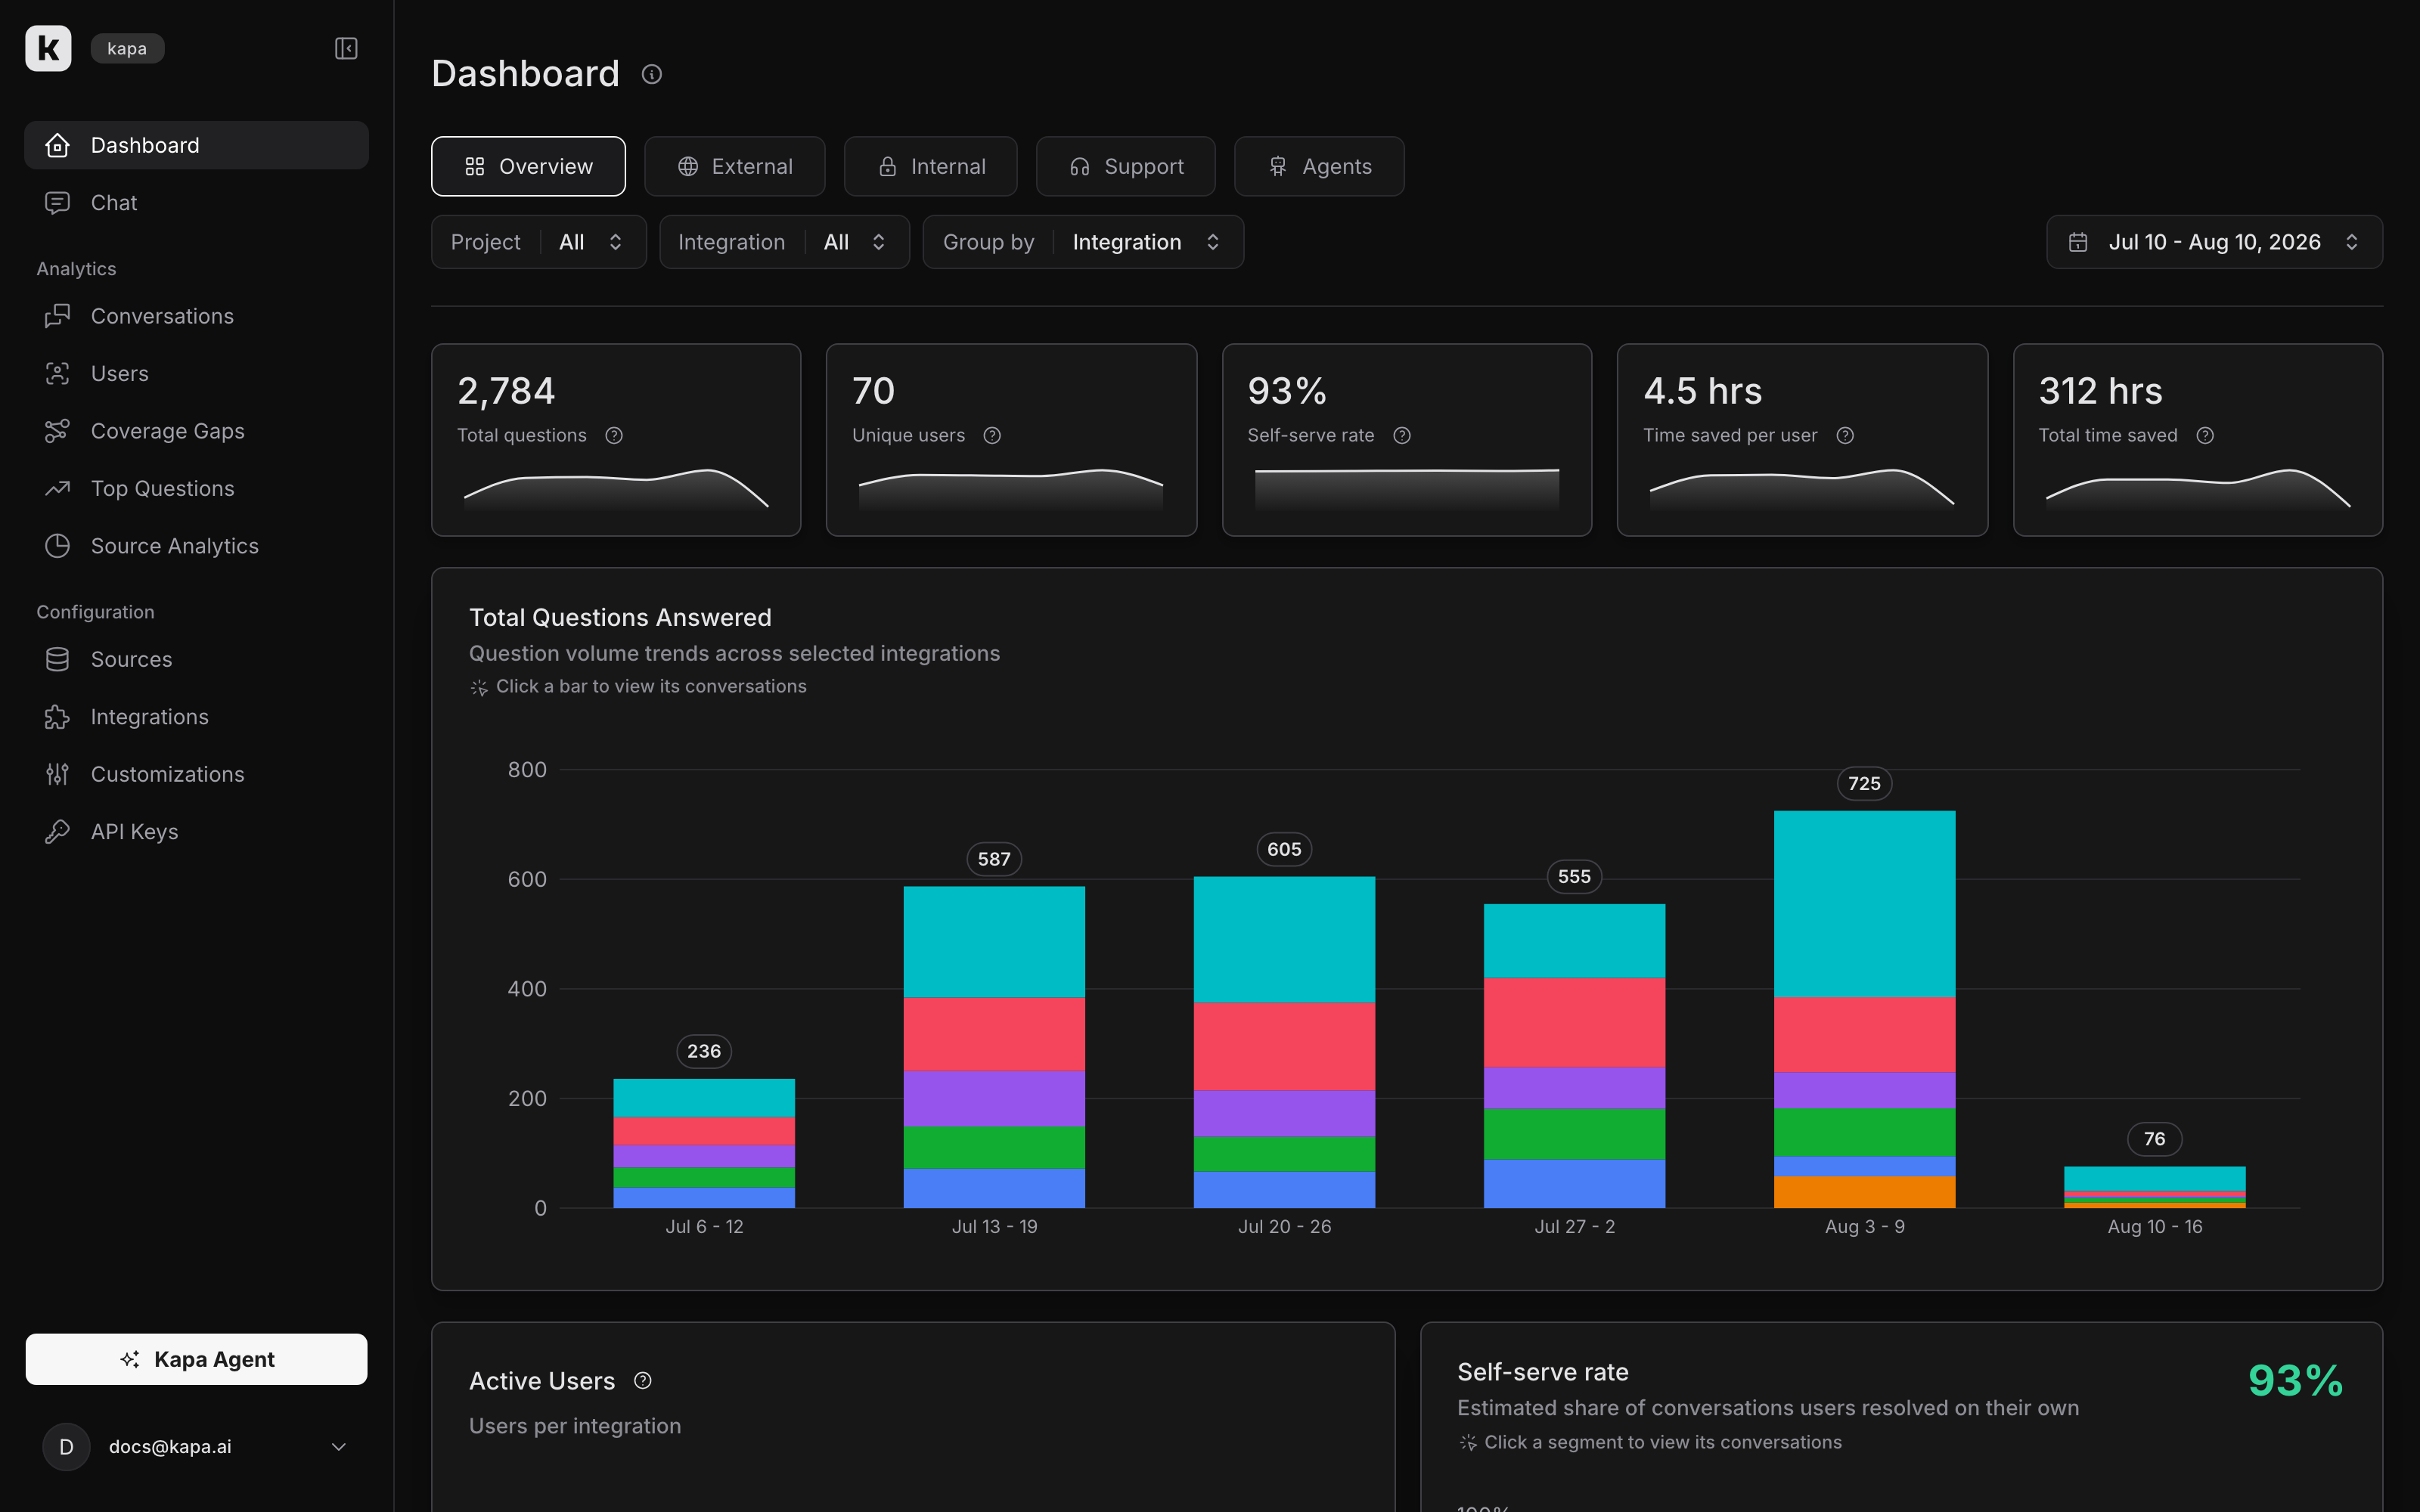
Because the dashboards sum over the projects you are permitted to read, teammates with different project permissions can see different totals for the same date range. Both views are correct for what each person can access.
Presets
The toolbar switches between five presets. Each preset is a dashboard of its own: it determines which projects are in scope and which cards and charts appear:
- Overview: every project, with satisfaction, language, and custom tag breakdowns.
- External: projects that serve your users, such as documentation and website deployments.
- Internal: projects that serve your own team, such as Slack Bot and Internal Technical Assistant deployments.
- Support: the Support Form Deflector's deflection funnel.
- Agents: traffic from AI agents connecting over MCP or the API.
Filters and date range
Below the presets sit three filters and a date range picker:
- Project: multi-select, grouped into External and Internal projects. An empty selection means every project in the preset's scope.
- Integration: multi-select. Under Support and Agents it narrows to the integrations those presets measure.
- Group by: stacks the charts by Integration (the default) or Project.
The date range picker scopes the whole page, with presets from the last 7 days to the last 12 months or a custom range.
The preset and the Project, Integration, and Group by selections are part of the page URL, so a copied link opens the same dashboard with most filters applied.
What each dashboard shows
Overview, External, and Internal
These three presets share one layout over different project scopes. Five stat cards, each with a trendline, sit at the top:
- Total questions: all questions asked across the selected projects and integrations.
- Unique users: distinct end users active in the selected range.
- Self-serve rate: the estimated share of conversations users resolved on their own. See Self-serve rate.
- Time saved per user (Time saved per employee on Internal): the range's total time saved divided by everyone active in it.
- Total time saved: the time Kapa saved over the range. See Time saved.
A card shows N/A when its value is unavailable, rather than a misleading zero.
Below the cards:
- Total Questions Answered: question volume over time, stacked by the chosen grouping.
- Active Users: users per project or integration over time. A user active in several projects appears in every stack, so the stacks can add up to more than the displayed total.
- Self-serve rate: the segmented breakdown described in Self-serve rate.
Each preset then adds its own cards:
- Overview: User Satisfaction, Language Distribution, and Custom Tags.
- External: User Satisfaction and Language Distribution.
- Internal: Top users, which ranks your most active users by questions asked, along with the time each user saved and when they were last active.
Support
Four cards summarize the deflection funnel: Deflection attempts, Successful deflections, Deflection rate, and Added to your team, which converts deflections into an estimate of equivalent support capacity. The Deflection rate over time chart plots successful deflections versus attempts per period. For how deflection is measured, see Deflection rates.
Agents
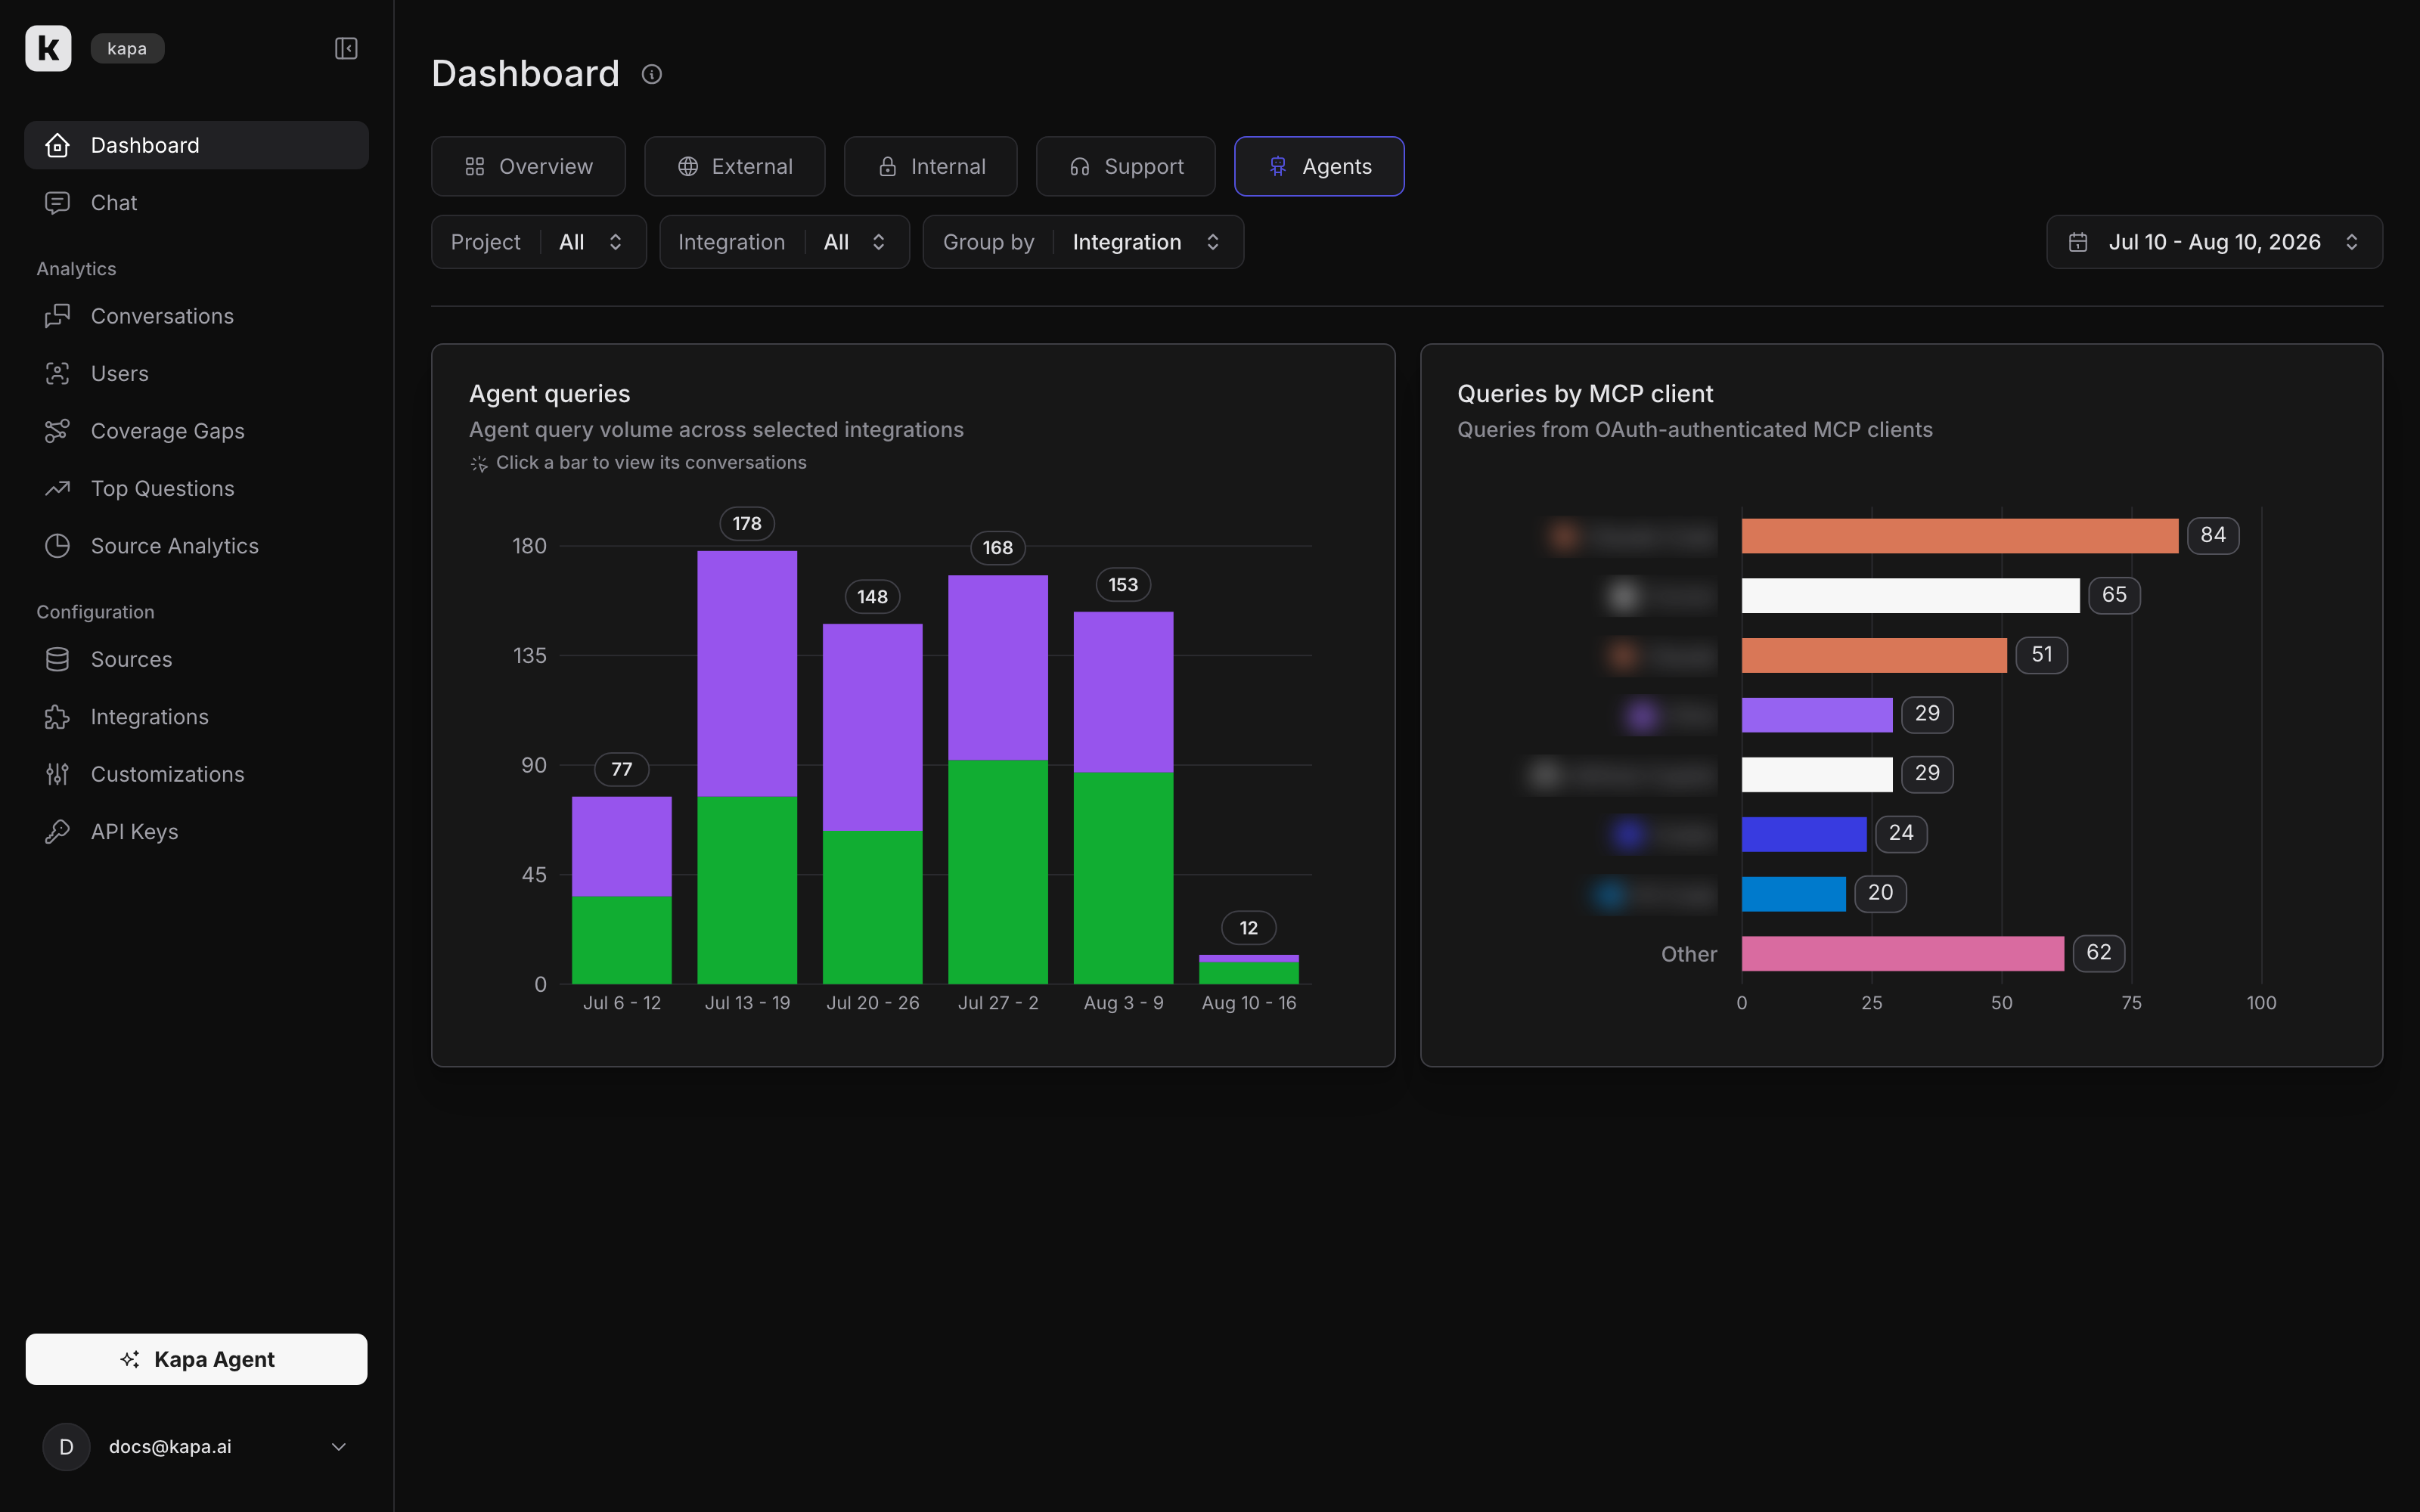
Two charts cover agent traffic: Agent queries, the query volume over time, and Queries by MCP client, which breaks queries down by the calling client, such as Claude or Cursor. See What counts as agent traffic.
Self-serve rate
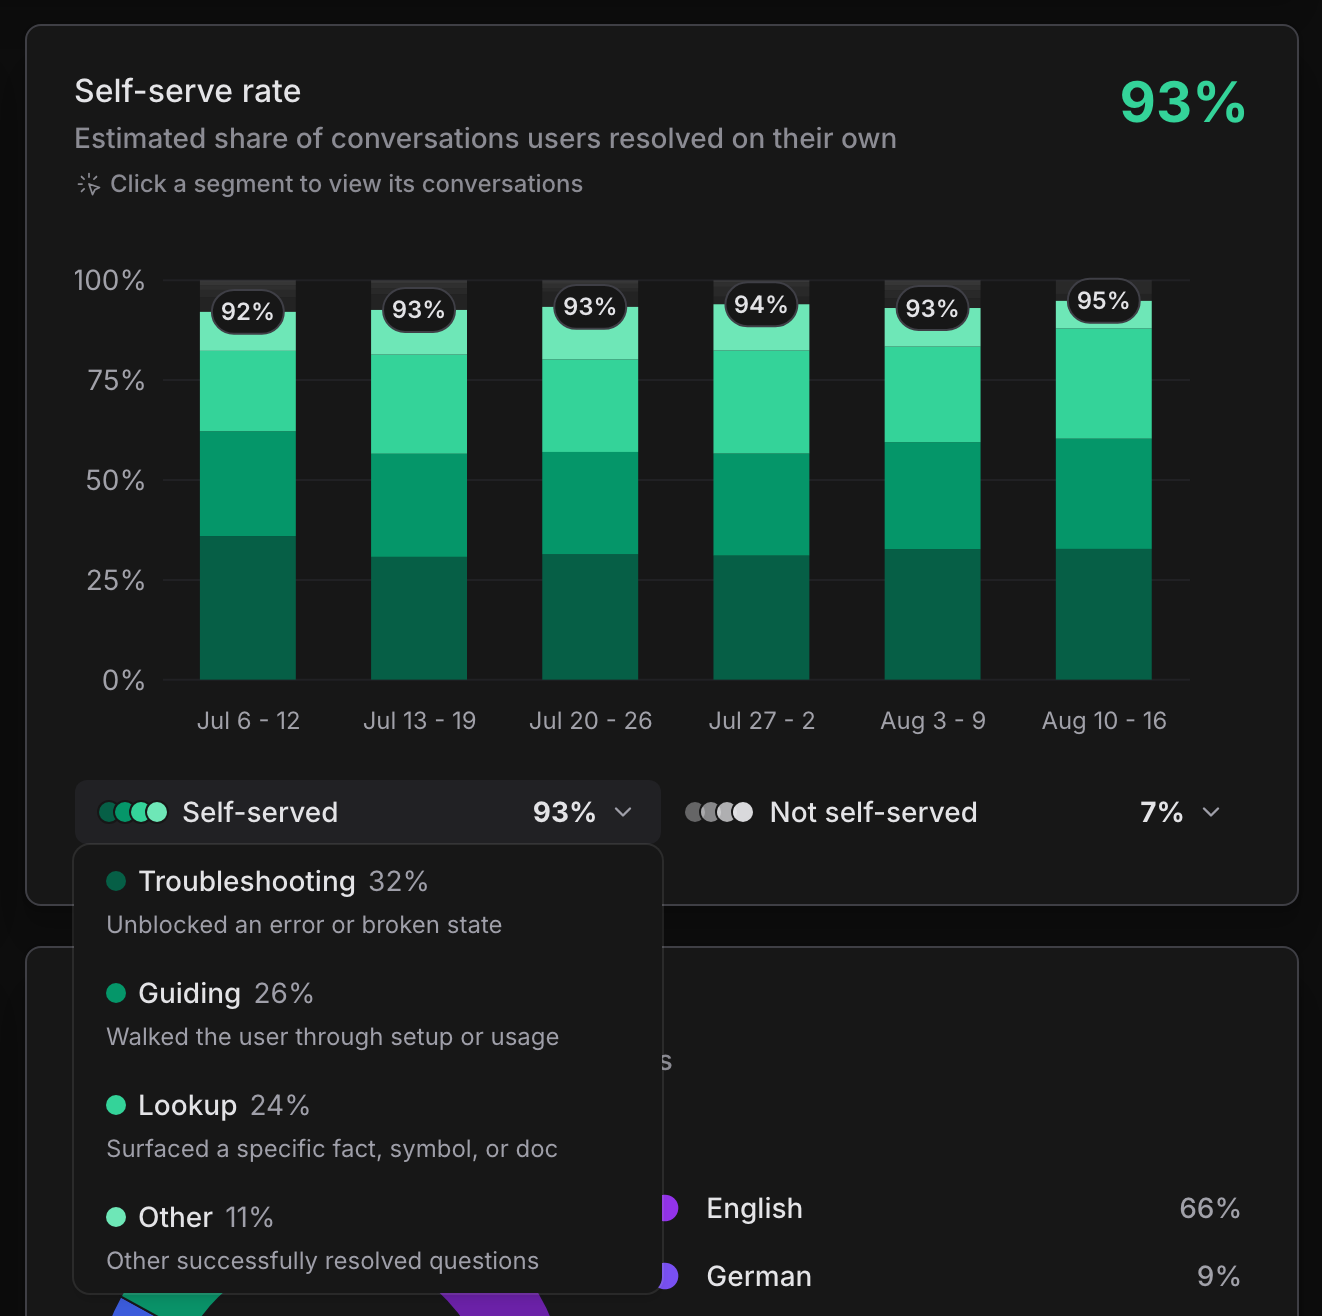
The self-serve rate estimates the share of conversations users resolved on their own, without needing help from your team. It is measured per conversation rather than per question, and conversations classified as off-topic are excluded. The remaining conversations are split across eight segments, four self-served and four not self-served. A conversation with a downvote, pushback, or negative sentiment counts fully in that not-self-served segment. Every other conversation earns self-served credit for its intent, reduced by its share of uncertain answers, which counts toward the Uncertain segment instead.
| Self-served segment | Meaning |
|---|---|
| Troubleshooting | Unblocked an error or broken state |
| Guiding | Walked the user through setup or usage |
| Lookup | Surfaced a specific fact, symbol, or doc |
| Other | Other successfully resolved questions |
| Not self-served segment | Meaning |
|---|---|
| Uncertain | Missing knowledge to answer confidently |
| Negative sentiment | User expressed frustration with the answer |
| Downvoted | User gave an explicit thumbs-down |
| Pushback | User questioned or corrected the answer |
The Self-serve rate chart stacks these segments per period. Open the Self-served and Not self-served legend groups to see each segment's share of the selected range.
The rate only covers conversations. When the selected range contains none, for example because all traffic in the range came through retrieval-only API queries, the card shows N/A and the chart reads No conversations to measure.
Time saved
Kapa estimates time saved using two fixed rates, which the cards also state in their tooltips:
- Each self-served question is estimated at 10 minutes.
- Each deflected support ticket is estimated at 15 minutes of handling time.
The per-question rate drives the Time saved per user, Time saved per employee, and Total time saved cards. The per-ticket rate drives Added to your team on the Support preset, which translates saved handling time into full-time-employee equivalents assuming an employee works 8-hour days, 20 days a month.
Drilling into conversations
Elements that resolve to a specific project or integration open the Conversations page pre-filtered to what you clicked:
- Bars in Total Questions Answered open the clicked project or integration and period. Bars in Agent queries do the same when grouping by Integration.
- Segments of the Self-serve rate chart and the rows in its legend groups open the conversations behind that segment.
- Rows in Custom Tags open the conversations carrying that tag.
What counts as agent traffic
The Agents preset counts queries from external AI agents that access your knowledge sources through Kapa, whether over a hosted MCP server or the API. These are one capability over two transports, so both appear in Agent queries.
The Queries by MCP client chart covers OAuth-authenticated MCP servers only, because only those reliably identify the calling client. Other agent traffic still counts in Agent queries but has no client breakdown.
Language distribution
See what languages your users use to query Kapa.
Supported languages
Kapa can detect the following languages:
English
Chinese
Russian
Spanish
Japanese
Portuguese
French
Korean
German
Vietnamese
Italian
Turkish
Polish
Arabic
Thai
Ukrainian
Danish
Indonesian
Hungarian
Dutch
Hindi
Bengali
Kapa includes any other languages in an Unknown category.
Programmatic access
Similar data to what is shown on the dashboards can be retrieved programmatically via the Activity API endpoint, which returns aggregate statistics including query counts, feedback, unique users, and support ticket deflections. The endpoint is scoped to a single project, while the dashboards aggregate across your team, so figures will differ.