Source Analytics
The Source Analytics tab shows which parts of your knowledge sources are most frequently referenced when answering user questions. Every answer Kapa provides is backed by specific sections of your knowledge sources, and this feature aggregates that information to show you what fraction of total questions are answered by each piece of documentation.
How it works
Source Analytics analyzes every conversation where Kapa successfully provides an answer. For each answer, it tracks which knowledge sources were referenced and builds a hierarchical view of your content's usage.
The analytics are presented as a tree structure with:
- Top-level domains: Shows the percentage of questions referencing each major knowledge source (e.g., documentation site, community forum)
- Detailed breakdowns: Displays the specific pages or sections within each source that are most frequently used to generate answers
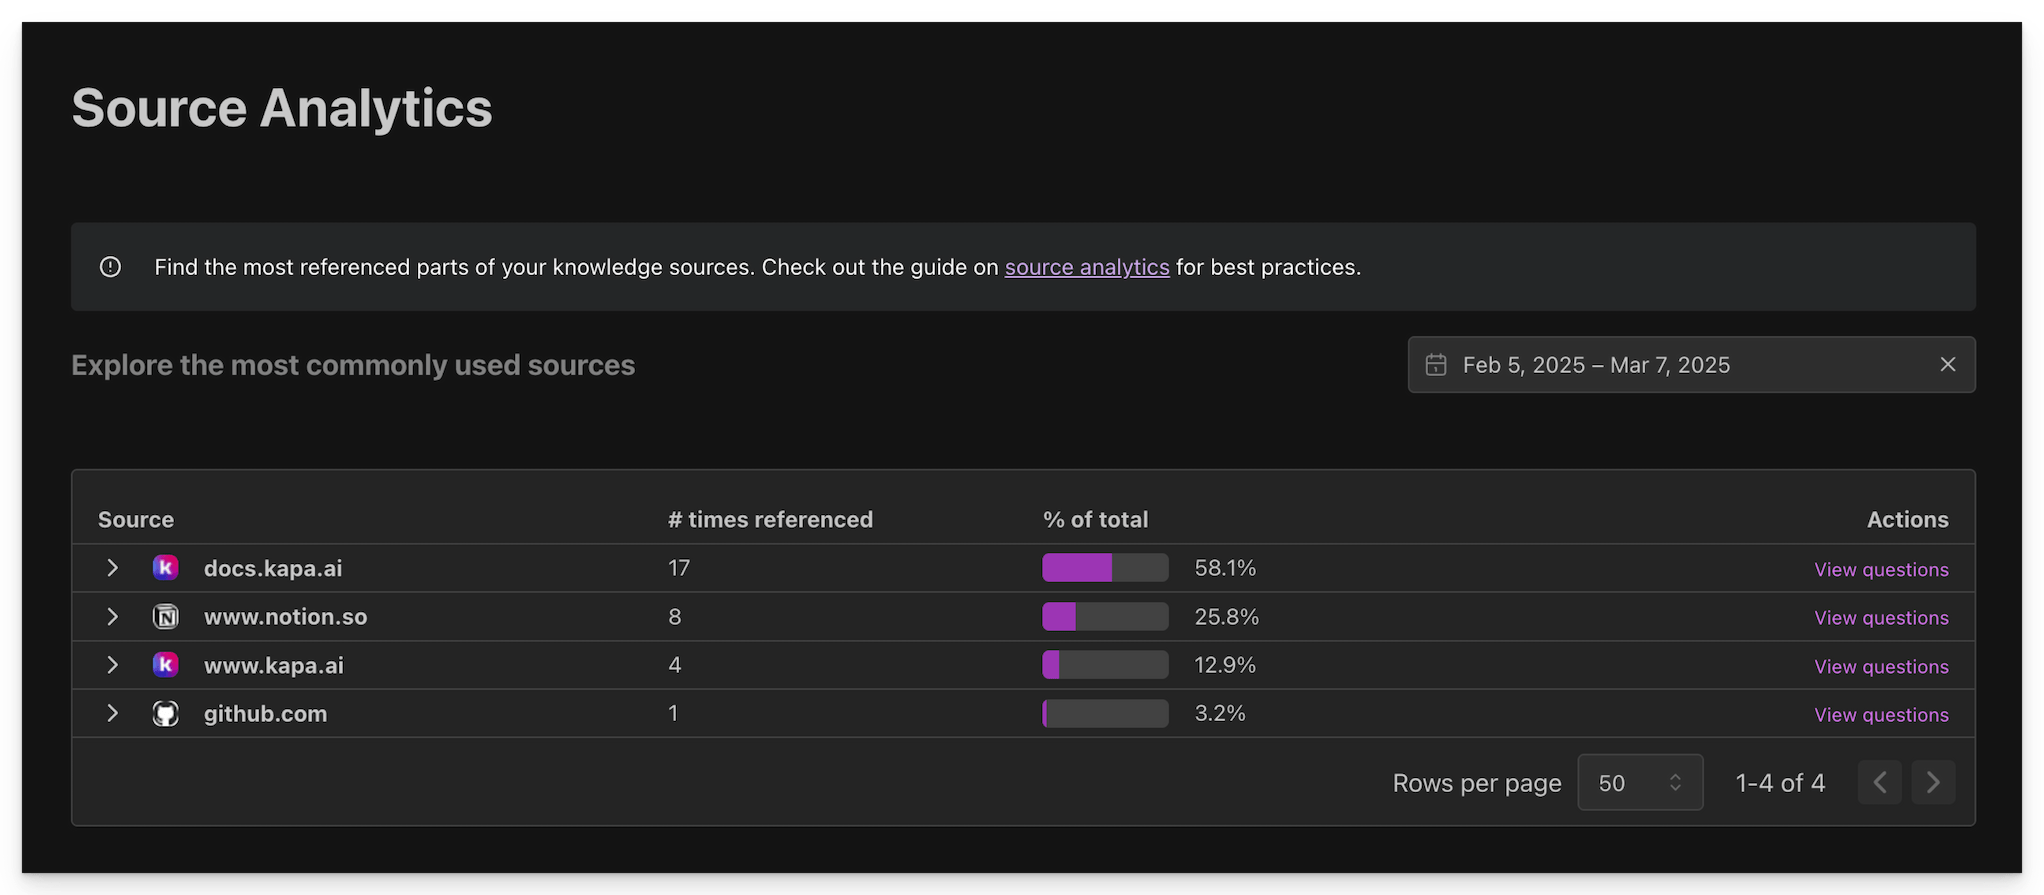
Viewing source importance
When you first open Source Analytics, you'll see a high-level breakdown of your different knowledge sources. This shows what fraction of total questions are answered by each source, helping you understand their relative importance.
Drilling down into specific content
You can explore specific areas of your documentation by clicking on any source to expand it. This reveals more detailed information about which pages or sections within that source are most frequently referenced.
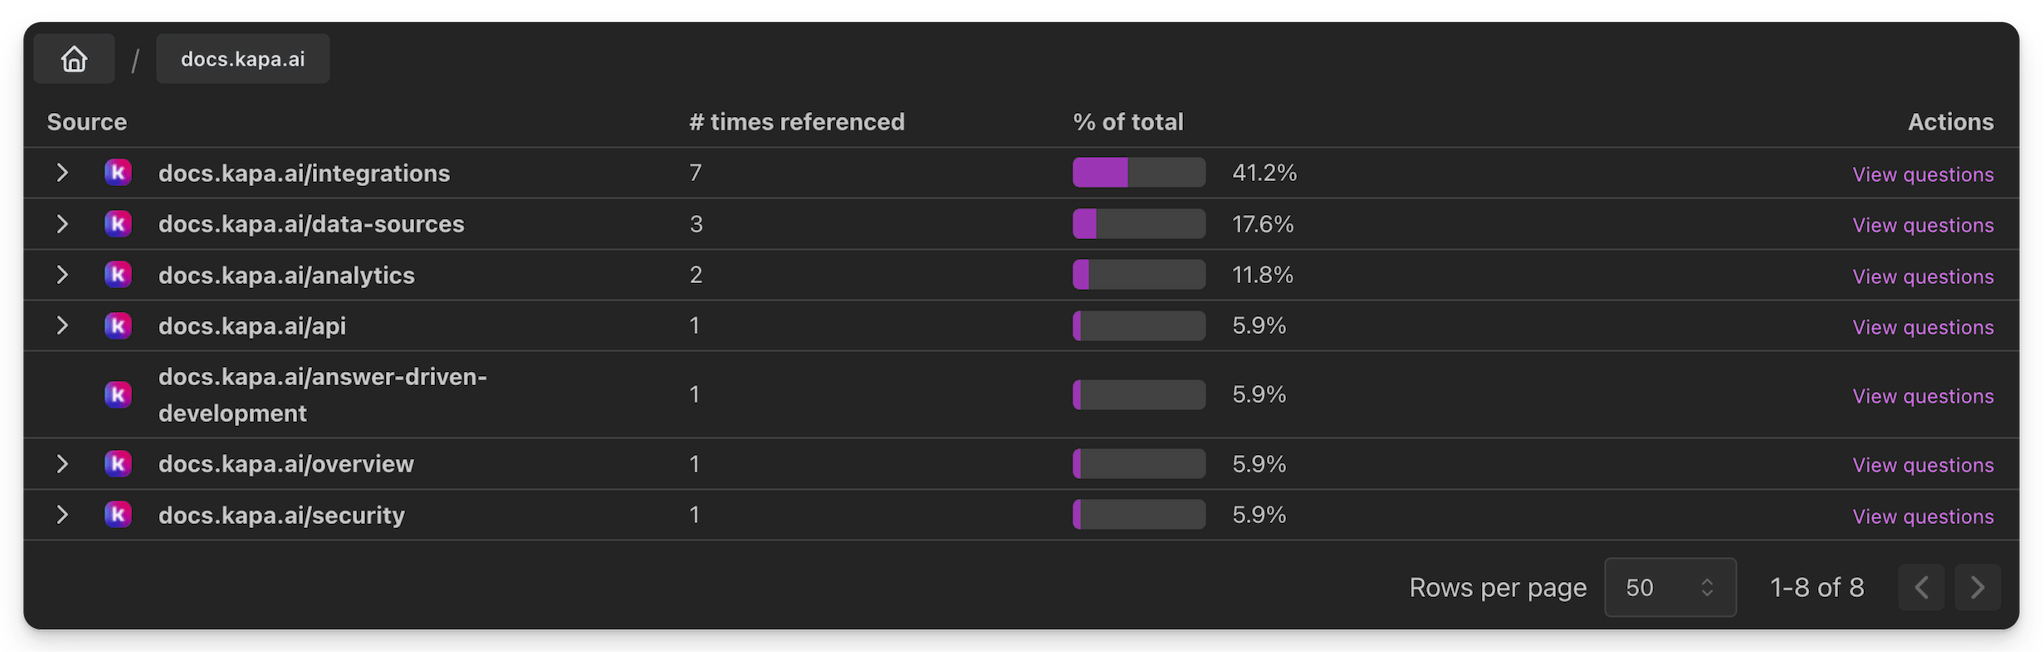
By drilling down, you can:
- Identify which documentation pages are most frequently referenced
- See what specific topics users are asking about most often
- Understand the relative importance of different sections within your knowledge base
This information helps you make informed decisions about where to focus your documentation efforts and which content is most valuable to your users.
Export source analytics
The source analytics export gives you a flat, row-level view of the same data that powers the tree above. It is flattened in two ways compared to the UI:
- The tree structure is gone. The UI lets you click into a domain to see its sub-pages; the export is a single flat list where each row is one citation, so a URL cited many times appears on many rows.
- The aggregates are gone. The UI shows reference counts and percent-of-total per source; the export shows one row per citation event without any pre-computed totals. You can compute those aggregates yourself from this file in a basic spreadsheet.
Each row represents one time a question/answer cited a URL in your knowledge base. This makes the file trivial to pivot for any analysis you want to run yourself. For example, grouping by Referenced URL in a spreadsheet gives you the most-cited URLs in the window, equivalent to the UI's top-level breakdown but without being locked into the tree shape. The same row layout supports other analyses the UI does not surface, such as counting citations per integration or finding URLs that show up alongside downvoted answers.
To export source analytics data to a CSV file:
- Set the desired date range using the date picker
- Optionally drill into a specific source URL to scope the export to that subtree
- Click the Export to CSV button next to the date picker
The exported CSV columns are:
| Column | Description |
|---|---|
| Referenced URL | The knowledge base URL that the answer cited as a source |
| Question | The user's question text |
| Answer | Kapa's response text |
| Is Uncertain | Whether Kapa expressed uncertainty in the answer |
| Answer Upvotes | Number of upvote reactions on the answer |
| Answer Downvotes | Number of downvote reactions on the answer |
| Feedback Comments | Comma-separated user-provided feedback comments on the answer |
| Custom Tags | Comma-separated list of custom tags assigned to the conversation |
| Integration | Name of the integration where the question was asked |
| Support Form Deflection Status | Success/Failure status for Support Form Deflector questions |
| Question Asked At (UTC) | When the question was asked |
| Question/Answer ID | Unique identifier for the individual Q/A interaction |
| Thread ID | Unique identifier for the conversation thread |
Recommended workflow
The recommended way to act on your Source Analytics is to use the Analyze Source Analytics skill with an AI agent.
- Install the skill from the kapa-skills repository into your documentation repository
- Export your Source Analytics for the time period you want to analyze
- Invoke the skill with your AI agent from within your documentation repository
The skill looks at each cited page and compares it against the questions it was cited in during your export window. Each page gets its own file to track progress. For each page, the agent reviews the questions, what Kapa actually answered, and the rest of your documentation (since the skill runs from inside your documentation repository), looking for patterns where the same change to the page would have improved the answer to multiple questions at once. You walk through each page one by one together with your agent. A page being cited often does not necessarily mean it needs work. You make the call, optionally fix the documentation on the spot, and move on to the next page. Progress is tracked so you can resume across multiple sessions.